graph8 for VP Sales / Head of Sales
A field guide for VP Sales. Live URLs, real surfaces. Screenshots captured from a showcase tenant with public-company data only.
The five things to use today
01. Total pipeline + weighted forecast — the exec kanban
Six-stage kanban with $total and $weighted per column. That’s your weighted commit number today. Drag-and-drop advances. Owner column on the list view shows which rep owns each deal.
Open it at
app.graph8.com/deals/pipeline— defaults to kanban view- 6 stages: New Meeting · Discovery Held · Solution Fit · Proposal Sent · Verbal Commit · Closed Won
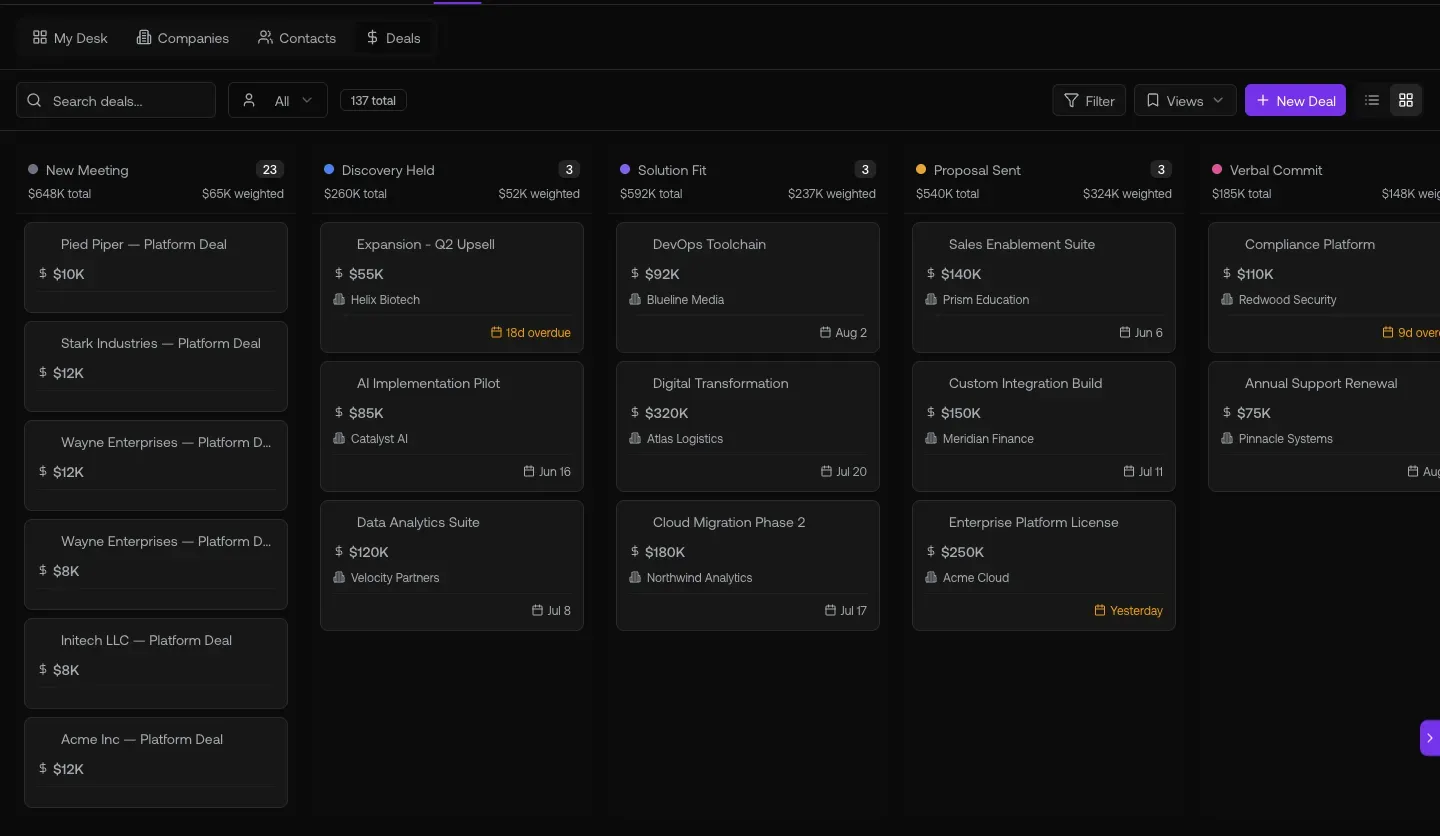
Fig 1.1 — /deals/pipeline kanban. Per-stage $total / $weighted. Sum the $weighted column across stages = your weighted pipeline. Compare against quota — gap = what your team needs to source/close this period.
02. The reports center — 13 sub-reports at ?report=aN
graph8’s /reports surface ships with 13 strategic dashboards. SDR Leaderboard, Meeting Pipeline, Account Health Comparison, Talk Time Quality, Connect Rate. Bookmark the report-ID URLs — deep-linkable.
Open these
/reports— Activity Trend (default landing)/reports?report=a8— SDR Leaderboard/reports?report=a5— Meeting Pipeline/reports?report=a14— Account Health Comparison/reports?report=a4— Connect Rate/reports?report=a9— SDR Grade Trends/reports?report=a10— SDR Daily Heatmap/reports?report=a12— Sequence Performance
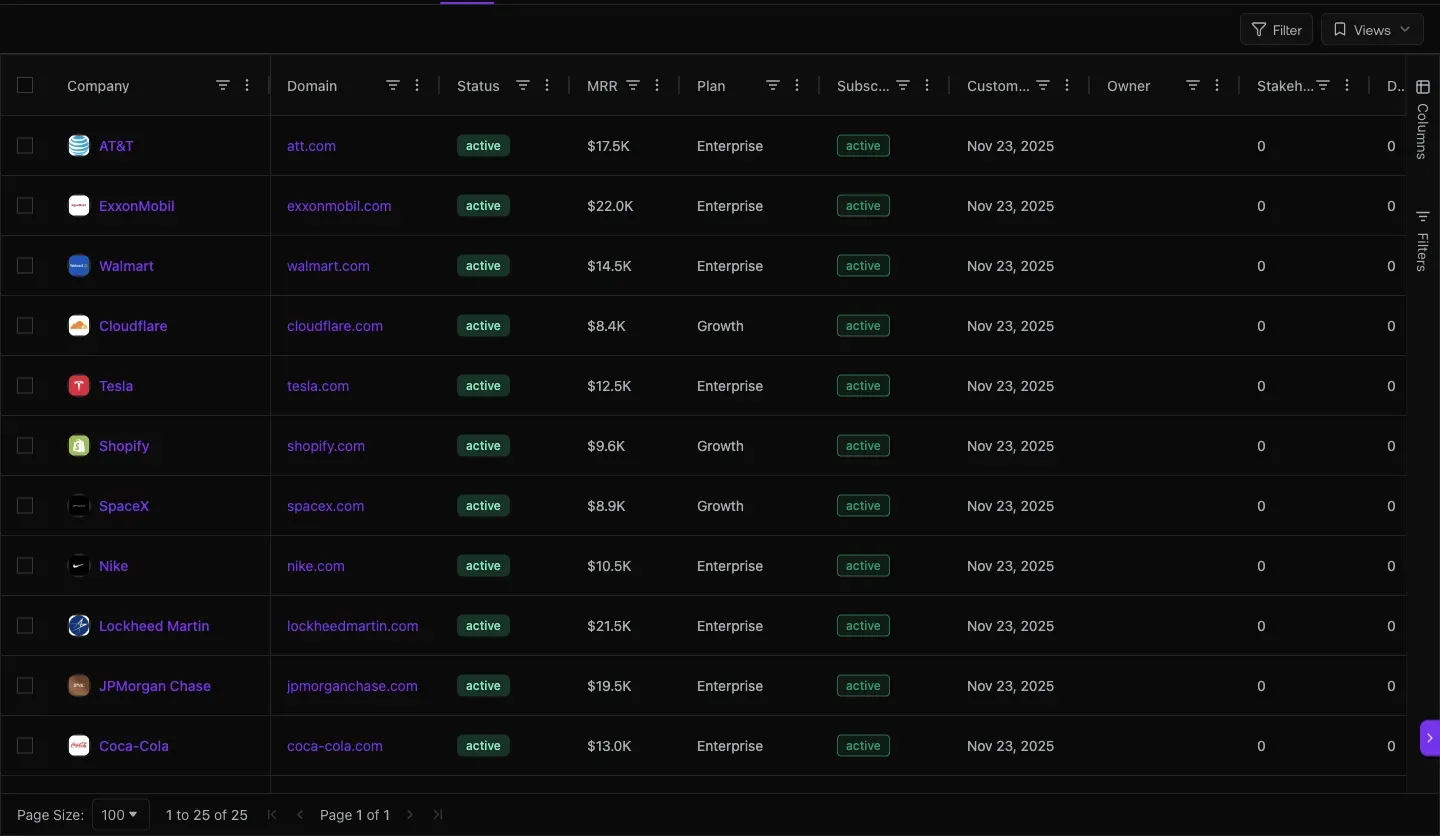
Fig 2.2 — ?report=a5 Meeting Pipeline. 73 booked · 3 cancelled · 70 net · 8 active workspaces. Tracks the leading indicator of AE pipeline conversion. (Heads-up: Held rate not tracked yet per backend note.)
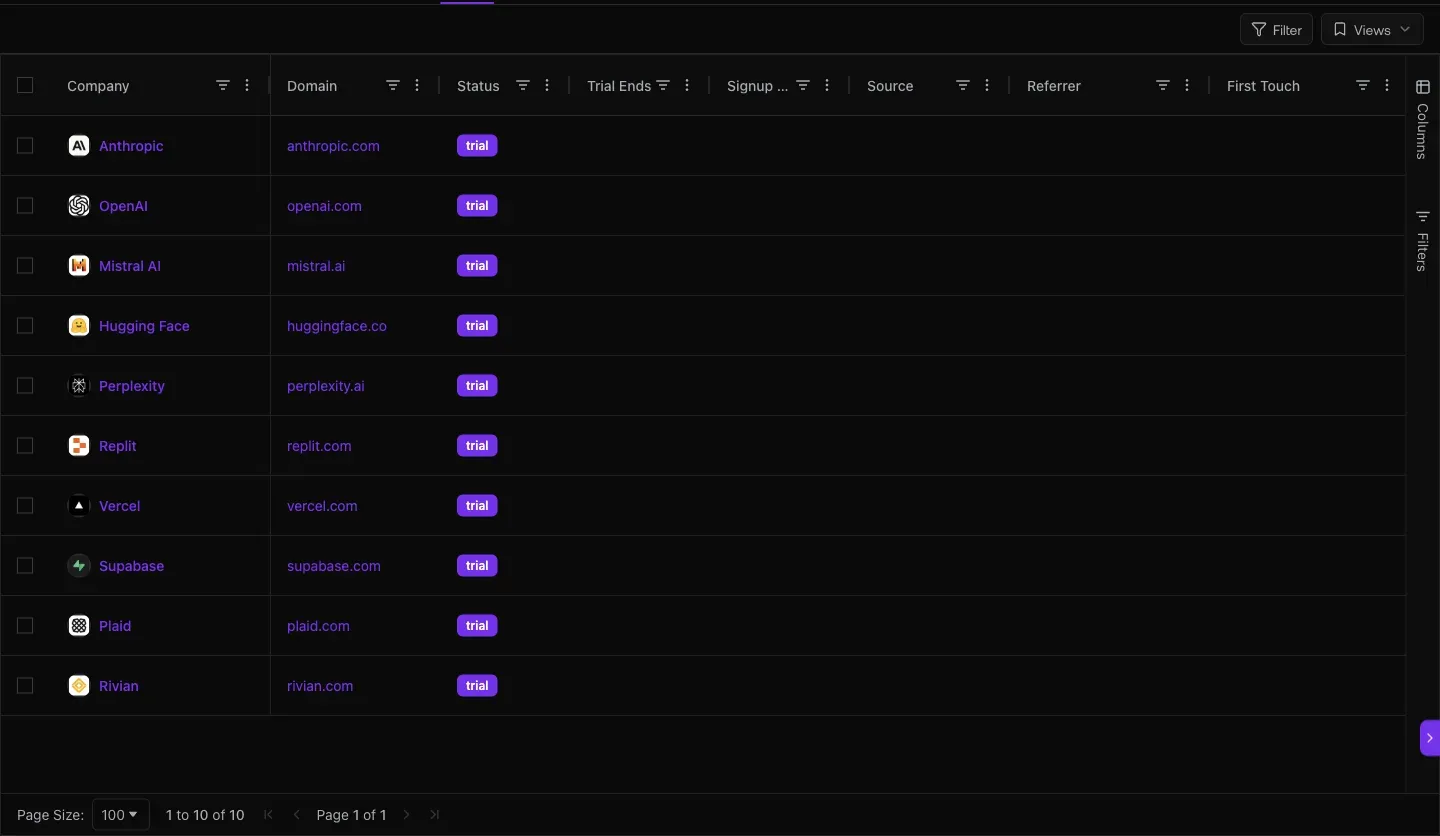
Fig 2.3 — ?report=a14 Account Health Comparison. 25 workspaces · 0.6% avg reply rate. Top by outbound volume: graph8 9,939 · a paying customer 7,412 · a paying customer 3,653 · a paying customer · your account. Use for cross-customer health audits.
03. Daily activity pulse — Performance Reports landing
The 7-day trend chart that tells you if the team is working. 40K emails · 9.2K dials · 235 replies · 0.6% reply rate · 72 meetings. If those tank for 3 days, something broke.
Open it at
app.graph8.com/reports— Activity Trend (default)
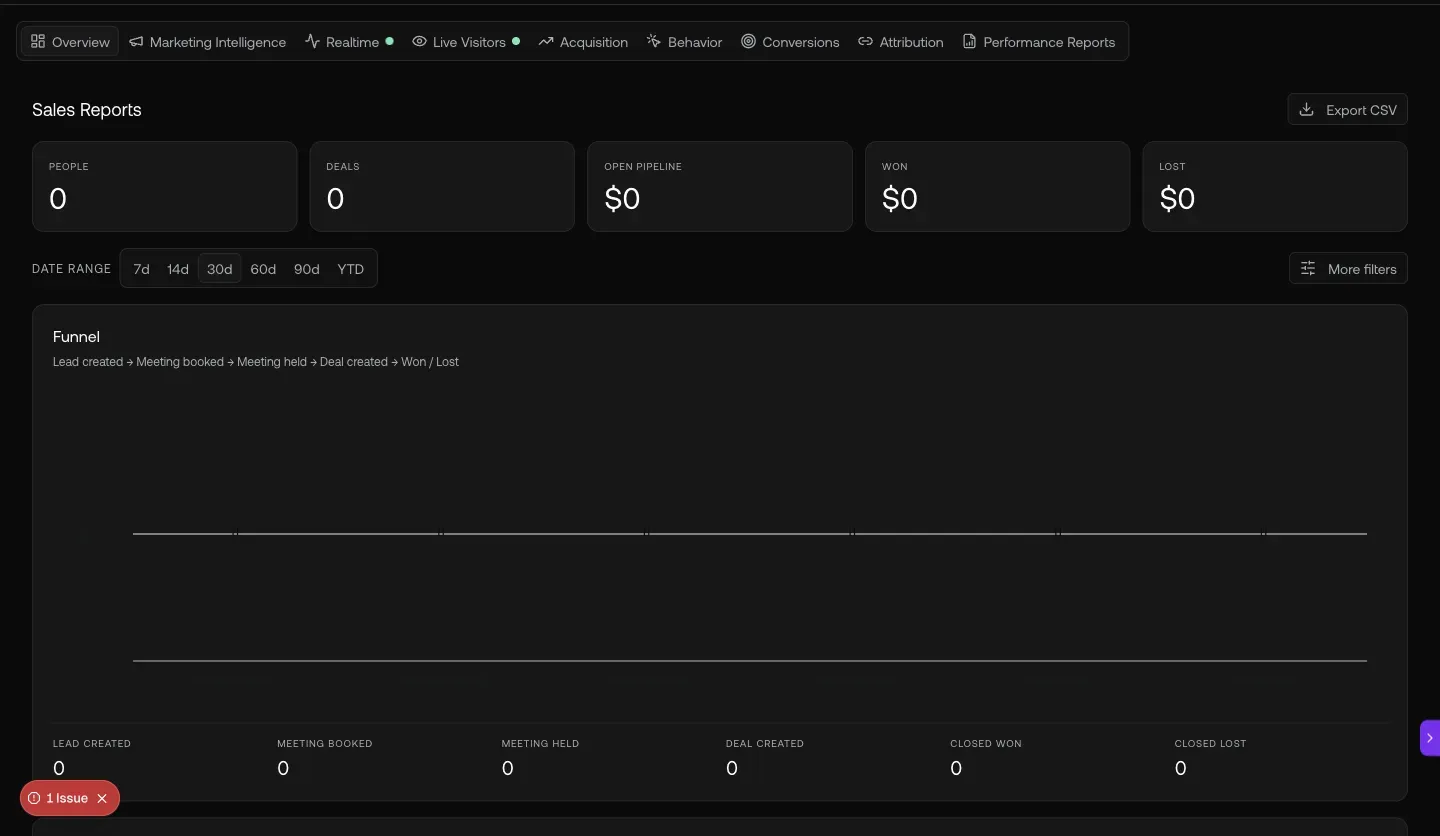
Fig 3.1 — /reports Activity Trend. Hero KPIs (7d) + activity-over-time chart (Emails / Dials / Replies / Meetings). Watch the trend line, not the absolute number.
04. Book of business + acquisition source — where the revenue comes from
your paying customers ranked by MRR (revenue concentration risk view). Trials in flight (conversion pipeline). Acquisition channels (where the next batch sources).
Open these
/deals/l/customers— paying book + MRR/deals/l/trials— trials with countdown timers/analytics/acquisition— channel mix
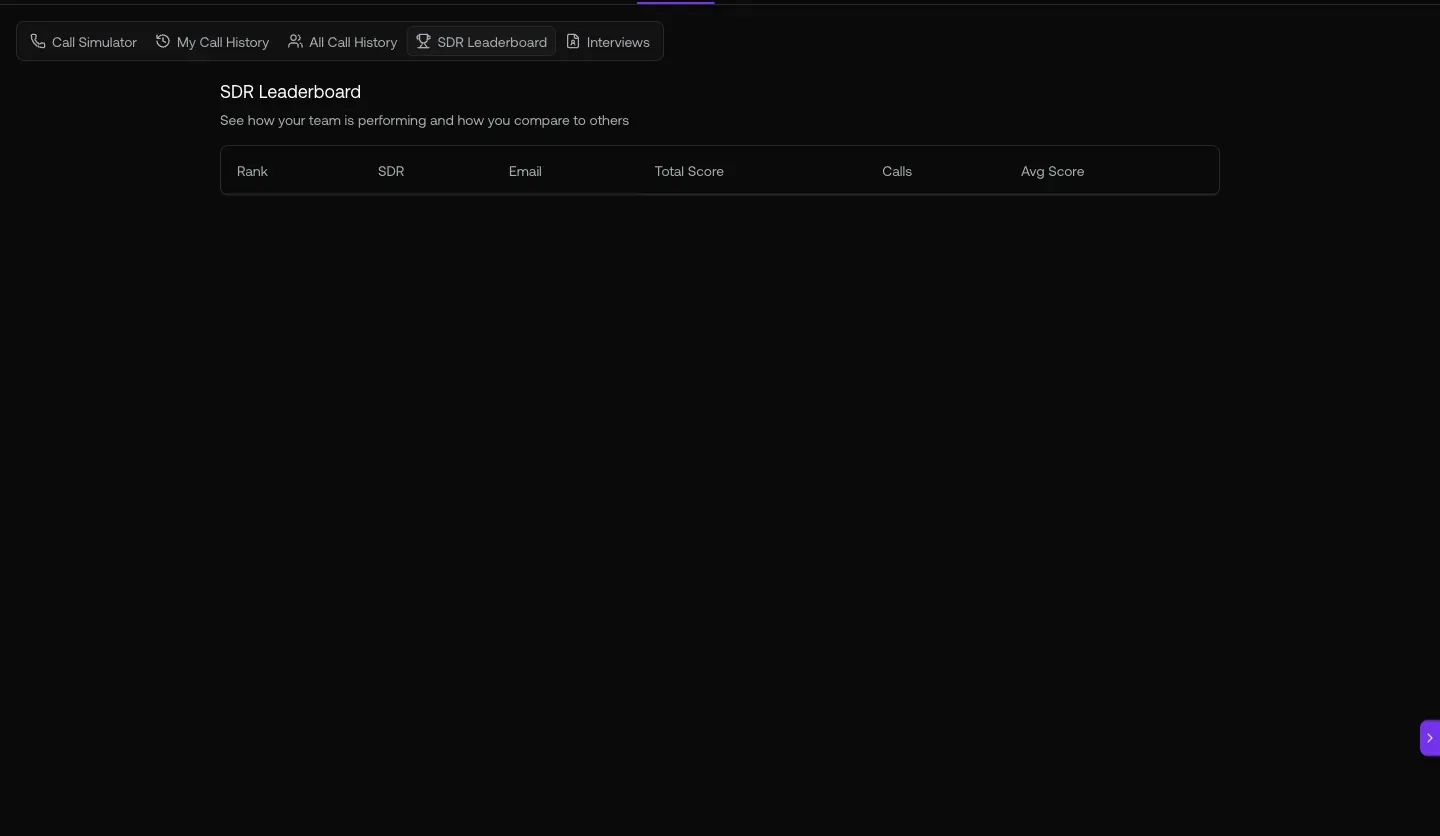
Fig 4.1 — /deals/l/customers. Top of book: a paying customer $8.8K · your account $4.0K · a paying customer $2.5K · a paying customer $2.5K · a paying customer $2.5K. Read this monthly for concentration risk: if your top 5 customers are 50%+ of MRR, that’s a board-level conversation.
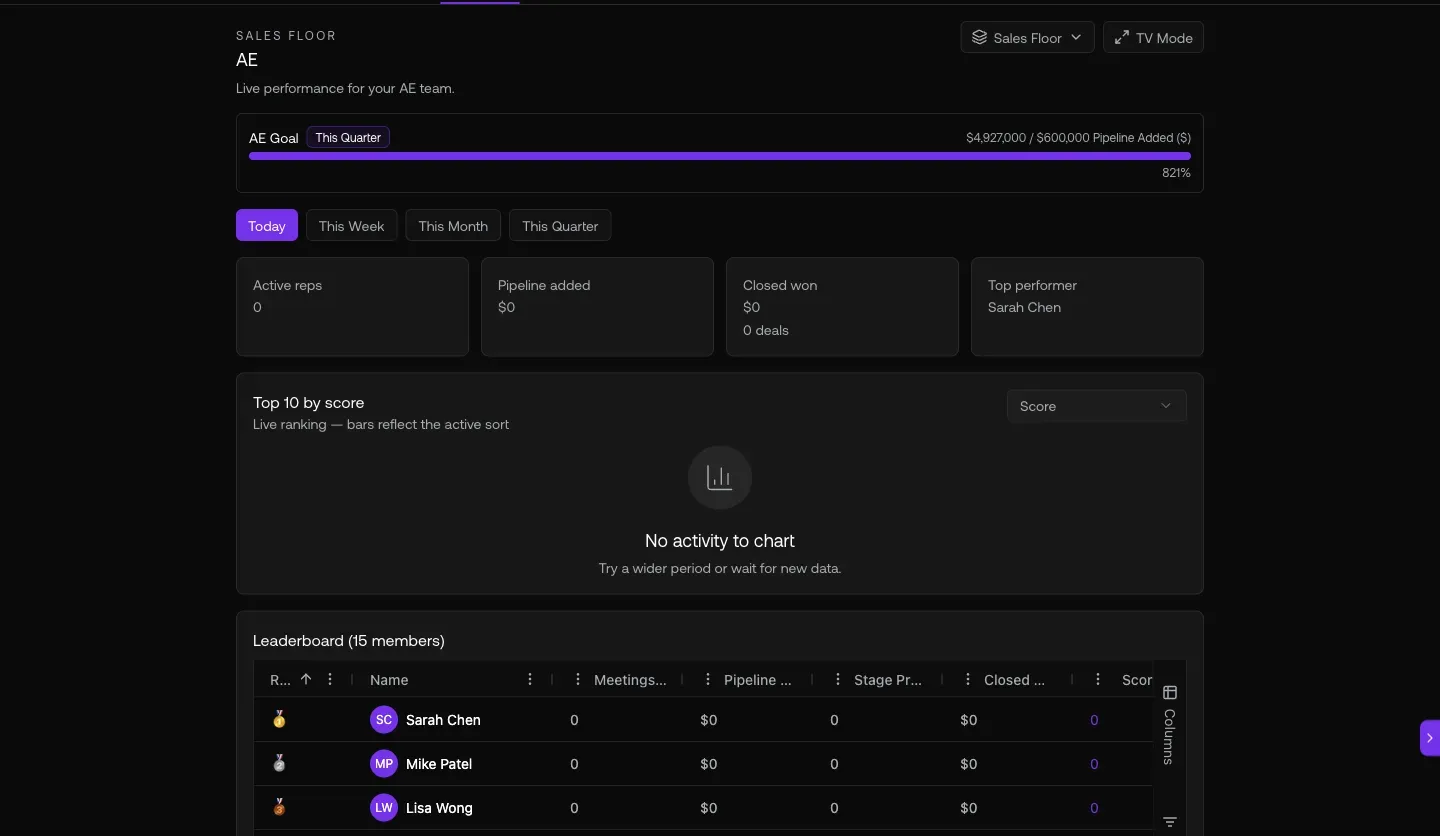
Fig 4.2 — /deals/l/trials. Countdowns visible. Anyone < 14 days = your highest-leverage conversion call.
05. Copilot — your strategic Q&A engine
Natural-language exec queries: weighted pipeline, sequence comparison, deals at risk, rep performance vs peers. Opens via Cmd+Shift+K from any page.
Open it at
- Cmd+Shift+K — global keyboard shortcut
- OR sparkle icon · top-right
- OR via Bridge — WhatsApp / Slack / iMessage / Roam (set up at
/profile?tab=apps)
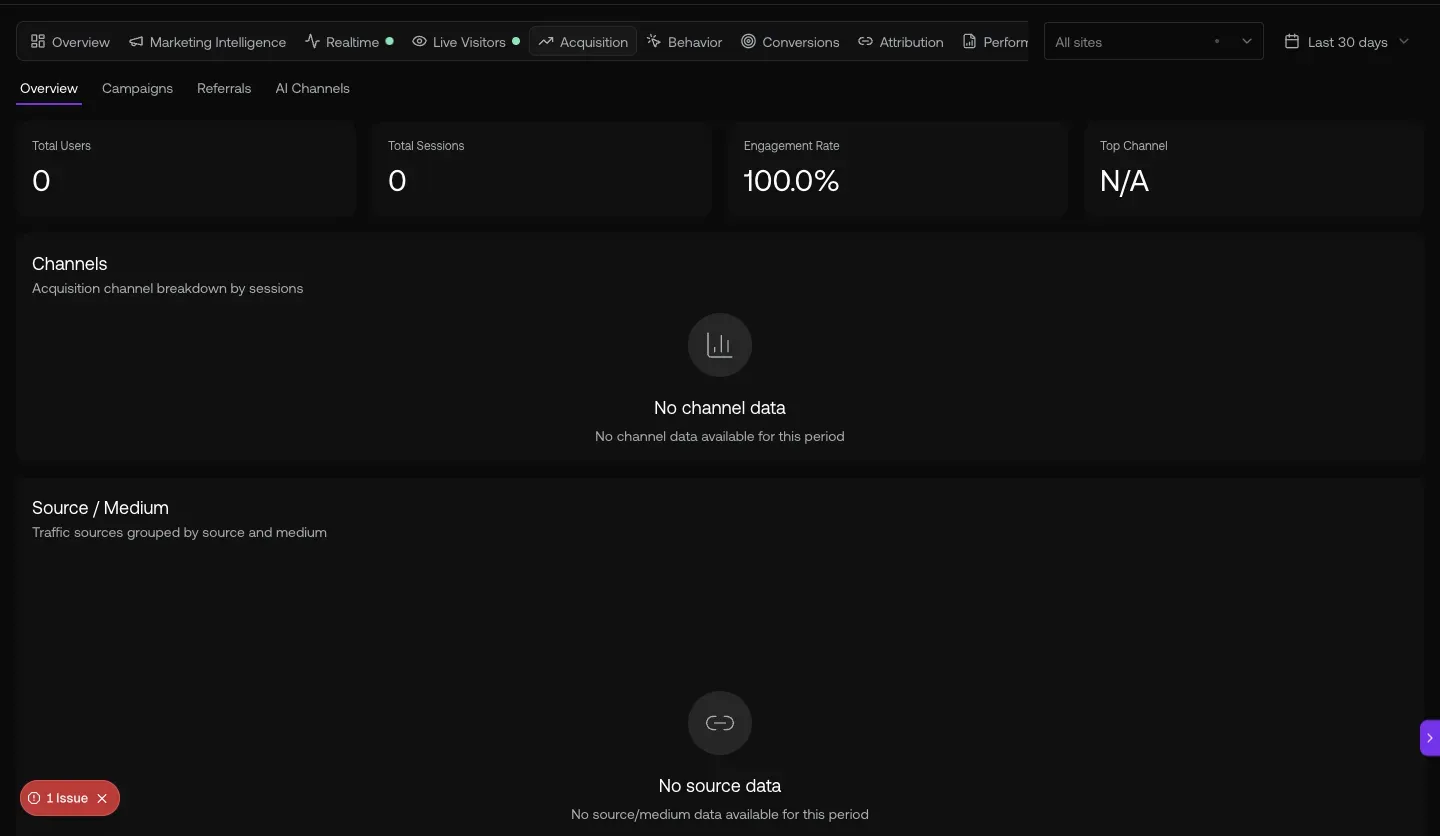
Fig 5.1 — Copilot opened via Cmd+Shift+K. Sidebar shows past query history (real exec patterns): “Show me my expansion candidates” · “Which contacts visited pricing” · “How many deals are in my pipeline” · “Build a contact list”. The chat history doubles as a query-template library.
The 13 report URLs (deep-linkable)
| Report | Direct URL |
|---|---|
| Activity Trend (landing) | /reports |
| Connect Rate | /reports?report=a4 |
| Meeting Pipeline | /reports?report=a5 |
| SDR Leaderboard | /reports?report=a8 |
| SDR Grade Trends | /reports?report=a9 |
| SDR Daily Heatmap | /reports?report=a10 |
| Sequence Performance | /reports?report=a12 |
| Account Health Comparison | /reports?report=a14 |
| Idle / Stalled accounts | /reports?report=a15 |
Full URL cheat-sheet
| To do this | Go here |
|---|---|
| Total pipeline + weighted kanban | /deals/pipeline |
| Customers + MRR ranking | /deals/l/customers |
| Trials in flight | /deals/l/trials |
| Churned (lost revenue) | /deals/l/churned |
| Daily activity pulse | /reports |
| Acquisition channels | /analytics/acquisition |
| Marketing Bridge Funnel | /analytics/marketing |
| Conversions (forms + meetings) | /analytics/conversions |
| Open Copilot anywhere | Cmd+Shift+K · or sparkle top-right |
Heads-up — known VP gaps + workarounds
Generated 2026-05-20 against
app.graph8.com (org your org). Surface state verified live before publication